Python用のインタラクティブなオープンソースのブラウザベースのグラフ作成ライブラリ「plotly」のインストールについて解説します。
「plotly(https://plotly.com/python/)」は、Pythonグラフ作成ライブラリで線図、散布図、面グラフ、棒グラフなど、様々なグラフを作成することができます。
■Python
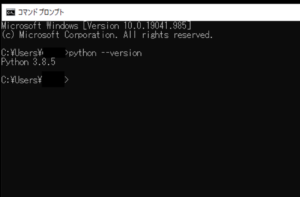
今回のPythonのバージョンは、「3.8.5」を使用しています。(Windows10)(pythonランチャーでの確認)
■plotlyをインストールする
plotlyをインストールを行いますが、今回はpipを経由してインストールを行うので、まずWindowsのコマンドプロンプトを起動します。
pip install plotly
起動後、上記のコマンドを入力し、Enterキーを押します。
なお、今回は、pythonランチャーを使用しており、Python Version 3.8.5にインストールを行うために、pipを使う場合にはコマンドでの切り替えを行います。
py -3.8 -m pip install plotly
切り替えるために、上記のコマンドを入力し、Enterキーを押します。
Defaulting to user installation because normal site-packages is not writeable
Collecting plotly
Downloading plotly-5.5.0-py2.py3-none-any.whl (26.5 MB)
|████████████████████████████████| 26.5 MB 3.3 MB/s
Collecting tenacity>=6.2.0
Downloading tenacity-8.0.1-py3-none-any.whl (24 kB)
Requirement already satisfied: six in c:\users\user_\appdata\roaming\python\python38\site-packages (from plotly) (1.15.0)
Installing collected packages: tenacity, plotly
Attempting uninstall: tenacity
Found existing installation: tenacity 5.1.5
Uninstalling tenacity-5.1.5:
Successfully uninstalled tenacity-5.1.5
Successfully installed plotly-5.5.0 tenacity-8.0.1
Enterキーを押すと、インストールが開始され、上記のように「Successfully installed」と表示されます。これが表示されれば、plotlyが正常にインストールされたことになります。
なお、今回はplotlyのバージョン5.5.0をインストールしました。


コメント